Loncat ke daftar isi utama

Bagaimana cara menghitung tingkat pertumbuhan tahunan rata-rata / gabungan di Excel?

Artikel ini membahas tentang cara menghitung Average Annual Growth Rate (AAGR) dan Compound Annual Growth Rate (CAGR) di Excel.


Hitung Tingkat Pertumbuhan Tahunan Majemuk di Excel

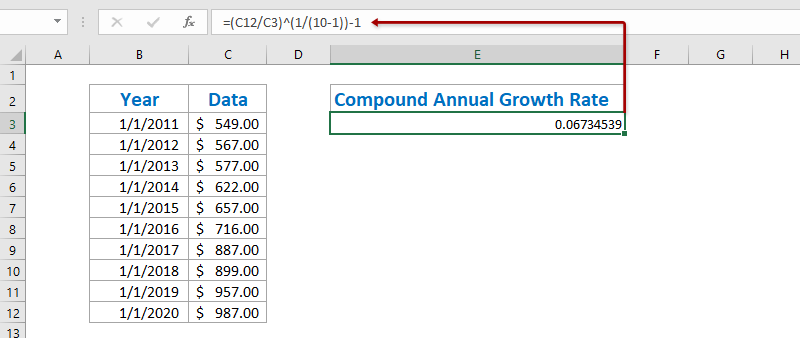
Untuk menghitung Tingkat Pertumbuhan Tahunan Majemuk di Excel, ada rumus dasar = ((Nilai Akhir / Nilai Awal) ^ (1 / Periode) -1. Dan kita dapat dengan mudah menerapkan rumus ini sebagai berikut:

1. Pilih sel kosong, misalnya Sel E3, masukkan rumus di bawah ini ke dalamnya, dan tekan Enter kunci. Lihat tangkapan layar:

=(C12/C3)^(1/(10-1))-1

Catatan: Dalam rumus di atas, C12 adalah sel dengan nilai akhir, C3 adalah sel dengan nilai awal, 10-1 adalah periode antara nilai awal dan nilai akhir, dan Anda dapat mengubahnya sesuai kebutuhan.

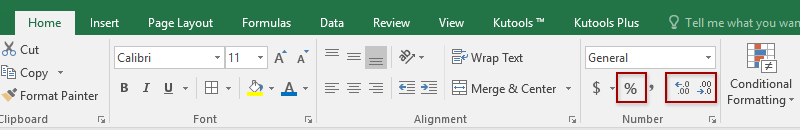
2. Dalam beberapa kasus, hasil kalkulasi mungkin tidak diformat sebagai persentase. Harap tetap memilih hasil perhitungan, klik Gaya Persen tombol  pada Beranda tab untuk mengubah angka ke format persentase, lalu ubah tempat desimalnya dengan mengklik Tingkatkan Desimal tombol  or Kurangi Desimal tombol . Lihat tangkapan layar:


Hitung tingkat pertumbuhan tahunan gabungan dengan fungsi XIRR di Excel

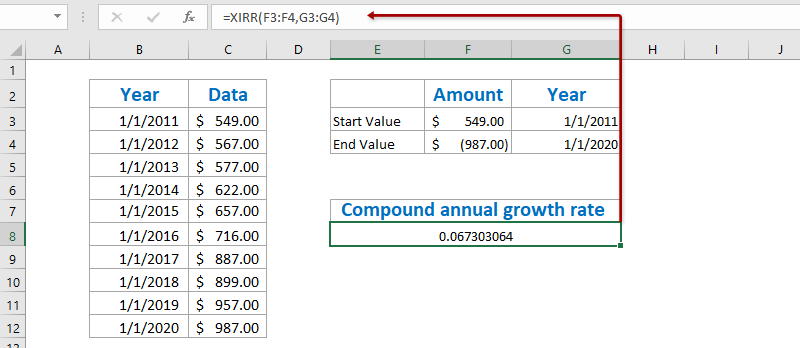
Sebenarnya fungsi XIRR dapat membantu kita menghitung Compound Annual Growth Rate di Excel dengan mudah, namun mengharuskan Anda membuat tabel baru dengan nilai awal dan nilai akhir.

1. Buat tabel baru dengan nilai awal dan nilai akhir seperti gambar layar pertama berikut yang ditampilkan:

Catatan: Di Sel F3 masukkan = C3, di Sel G3 masukkan = B3, di Sel F4 masukkan = -C12, dan di Sel G4 masukkan = B12, atau Anda dapat langsung memasukkan data asli ke tabel ini. Ngomong-ngomong, Anda harus menambahkan minus sebelum Nilai Akhir.

2. Pilih sel kosong di bawah tabel ini, masukkan rumus di bawah ini ke dalamnya, dan tekan Enter kunci.

= XIRR (F3: F4, G3: G4)

3. Untuk mengubah hasil ke format persentase, pilih Sel dengan fungsi XIRR ini, klik Gaya Persen tombol  pada Beranda tab, lalu ubah tempat desimalnya dengan mengklik Tingkatkan Desimal tombol  or Kurangi Desimal tombol . Lihat tangkapan layar:

Simpan tabel CAGR dengan cepat sebagai template mini, dan gunakan kembali hanya dengan satu klik di masa mendatang

Pasti sangat membosankan untuk merujuk sel dan menerapkan rumus untuk menghitung rata-rata setiap saat. Kutools for Excel menyediakan solusi yang lucu dari Teks otomatis utilitas untuk menyimpan rentang sebagai entri AutoTeks, yang bisa tetap menjadi format sel dan rumus dalam rentang. Dan kemudian Anda akan menggunakan kembali rentang ini hanya dengan satu klik.

teks otomatis doc cagr


Hitung Rata-Rata Tingkat Pertumbuhan Tahunan di Excel

Untuk menghitung Rata-Rata Tingkat Pertumbuhan Tahunan di excel, biasanya kita harus menghitung tingkat pertumbuhan tahunan setiap tahun dengan rumus = (Nilai Akhir - Nilai Awal) / Nilai Awal, dan kemudian rata-rata tingkat pertumbuhan tahunan ini. Anda dapat melakukan sebagai berikut:

1. Selain tabel asli, masukkan rumus di bawah ini ke dalam Cell C3 kosong dan, lalu seret Fill Handle ke Range C3: C11.

= (C4-C3) / C3

2. Pilih Range D4: D12, klik Gaya Persen tombol  pada Beranda tab, lalu ubah tempat desimalnya dengan mengklik Tingkatkan Desimal tombol  or Kurangi Desimal tombol . Lihat tangkapan layar:

3. Rata-rata semua tingkat pertumbuhan tahunan dengan memasukkan rumus di bawah ini ke Sel F4, dan tekan Enter kunci.

= RATA-RATA (D4: D12)

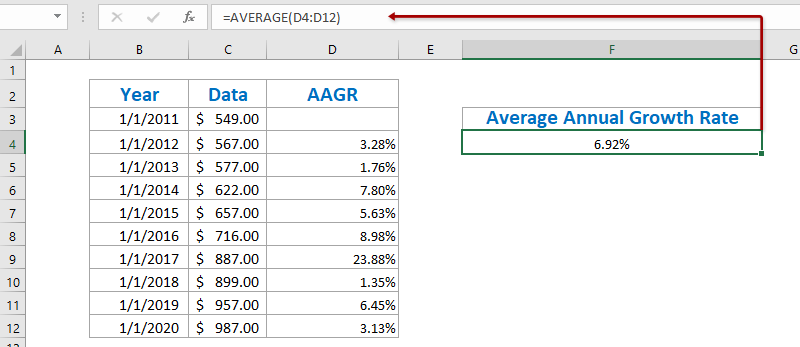
Hingga saat ini, Laju Pertumbuhan Tahunan Rata-rata telah dihitung dan ditampilkan di Sel C12.


Demo: hitung tingkat pertumbuhan tahunan rata-rata / gabungan di Excel


Kutools untuk Excel: Lebih dari 300 alat praktis di ujung jari Anda! Mulai uji coba gratis 30 hari Anda tanpa batasan fitur hari ini. Download Sekarang!

Artikel terkait:

Alat Produktivitas Kantor Terbaik

🤖 Kutools AI Ajudan: Merevolusi analisis data berdasarkan: Eksekusi Cerdas   |  Hasilkan Kode  |  Buat Rumus Khusus  |  Analisis Data dan Hasilkan Grafik  |  Aktifkan Fungsi Kutools...
Fitur Populer: Temukan, Sorot, atau Identifikasi Duplikat   |  Hapus Baris Kosong   |  Gabungkan Kolom atau Sel tanpa Kehilangan Data   |   Putaran tanpa Formula ...
Pencarian Super: VLookup Beberapa Kriteria    VLookup Nilai Berganda  |   VLookup di Beberapa Lembar   |   Pencarian Fuzzy ....
Daftar Drop-down Lanjutan: Buat Daftar Drop Down dengan Cepat   |  Daftar Drop Down yang Bergantung   |  Multi-pilih Drop Down List ....
Manajer Kolom: Tambahkan Jumlah Kolom Tertentu  |  Pindahkan Kolom  |  Alihkan Status Visibilitas Kolom Tersembunyi  |  Bandingkan Rentang & Kolom ...
Fitur Unggulan: Fokus Kisi   |  Tampilan Desain   |   Bar Formula Besar    Manajer Buku Kerja & Lembar   |  Perpustakaan Sumberdaya (Teks otomatis)   |  Pemetik tanggal   |  Gabungkan Lembar Kerja   |  Enkripsi/Dekripsi Sel    Kirim Email berdasarkan Daftar   |  Filter Super   |   Filter Khusus (filter tebal/miring/coret...) ...
15 Perangkat Teratas12 Teks Tools (Tambahkan Teks, Hapus Karakter, ...)   |   50 + Grafik jenis (Gantt Chart, ...)   |   40+ Praktis Rumus (Hitung usia berdasarkan ulang tahun, ...)   |   19 Insersi Tools (Masukkan Kode QR, Sisipkan Gambar dari Jalur, ...)   |   12 Konversi Tools (Angka ke Kata, Konversi Mata Uang, ...)   |   7 Gabungkan & Pisahkan Tools (Lanjutan Gabungkan Baris, Pisahkan Sel, ...)   |   ... dan banyak lagi

Tingkatkan Keterampilan Excel Anda dengan Kutools for Excel, dan Rasakan Efisiensi yang Belum Pernah Ada Sebelumnya. Kutools for Excel Menawarkan Lebih dari 300 Fitur Lanjutan untuk Meningkatkan Produktivitas dan Menghemat Waktu.  Klik Di Sini untuk Mendapatkan Fitur yang Paling Anda Butuhkan...

Deskripsi Produk


Tab Office Membawa antarmuka Tab ke Office, dan Membuat Pekerjaan Anda Jauh Lebih Mudah

  • Aktifkan pengeditan dan pembacaan tab di Word, Excel, PowerPoint, Publisher, Access, Visio, dan Project.
  • Buka dan buat banyak dokumen di tab baru di jendela yang sama, bukan di jendela baru.
  • Meningkatkan produktivitas Anda sebesar 50%, dan mengurangi ratusan klik mouse untuk Anda setiap hari!
Comments (22)
No ratings yet. Be the first to rate!
This comment was minimized by the moderator on the site
Thank u very much for important scientific information
This comment was minimized by the moderator on the site
How to calculate average of percentage CAGR Return ?
Example :

28.6%

34.9%

25.5%

-2.8%

16.0%
This comment was minimized by the moderator on the site
You can also just use the RATE() formula with setting PMT to 0. RATE(9,0,-549,987) = 6.73%. Built right into Excel already.
This comment was minimized by the moderator on the site
Your period is wrong in CAGR formula ?
This comment was minimized by the moderator on the site
I agree, there's only 9 periods from 1/1/11 to 1/1/20. Ten periods would be 1/1/11 to 12/31/20. Please explain
This comment was minimized by the moderator on the site
Hi - I'm trying to work backwards to find the highest price I can buy a share at when I have a total expected return. Are you able to please help me by reverse engineering the formula to work this out. Using your example - I'm trying to work out what the "3" should be 2.43443 =(3200/x)^(1/(40-8))-1
This comment was minimized by the moderator on the site
Hi,

I have 7 fiscal years of foot traffic data for a retail store:

FY12 FY13 FY14 FY15 FY16 FY17 FY18
2653 2848 2871 2925 2685 2923 3000

My question is: while traffic is increasing, is it increasing at a decreasing rate? Is the growth slowing?


Your first example "(B11/B2)^(1/(10-1))-1" takes the end value and beginning value to get the CAGR. The part I don't understand is that, what about the values in the middle? How does only taking the end and beginning value determine the growth rate accurately? Is there another method where it takes all the fiscal year values into account?
This comment was minimized by the moderator on the site
FY12 - 2653
FY13 - 2848
FY14 - 2871
FY15 - 2925
FY16 - 2685
FY17 - 2923
FY18 - 3000
This comment was minimized by the moderator on the site
Hi Robert,
You can use this formula = (Ending Value - Beginning Value) / Beginning Value to calculate the growth rate of each year, and then compare those growth rates one by one.
This comment was minimized by the moderator on the site
Can someone help with this problem using excel?

The following data show average growth of the human embryo prior to birth.
EMBRYO AGE IN WEEKS WEIGHT IN GRAMS
8 3
12 36
20 330
28 1000
36 2400
40 3200

a). Find the quadratic function of “best fit” for this data. Write this function in standard form: f(x) = ax2 + bx + c.
b). Make a sketch of the scatter plot and the parabola. Plot the quadratic function found above the Y = menu.
c). According to your model, what would a 32-week embryo weigh?
d). According to your model, what week would an embryo weigh 3000 grams?
e). Could the model be used for weight of an embryo for any number of weeks age (such as 100 or 200)? Explain
This comment was minimized by the moderator on the site
Hi Wayne,
You can calculate the Compound Annual Growth Rate with the second method:
=(3200/3)^(1/(40-8))-1
This comment was minimized by the moderator on the site
There is a new tool that will fit to your planning software. MS Excel is a spreadsheet developed by Microsoft for Windows, macOS, Android and iOS. It features calculation, graphing tools, pivot tables, and a macro programming language called Visual Basic for Applications. Thus, it can do Bookkeeping/Accounting, Budgeting (Existing Year and Long Term) and Data Analysis.
This comment was minimized by the moderator on the site
In the CAGR formula, why we are using -1 at the end. I am using two formulaes 1) (I5/I4)^(1/(25-1))-1 2)(I5/I4)^(1/(25)-1) which one is correct..? Please help me out on this thank you.
This comment was minimized by the moderator on the site
The first formula you are using is the correct one!
This comment was minimized by the moderator on the site
The formula is actually CORRECT, but the explanation is incorrect. There are 10 dates that represent 9 periods. It should say that "n-1" means "dates-1", not "periods - 1". You can verify it yourself by increasing each year by this example's n-1 CAGR and you will get the final result.
There are no comments posted here yet
Load More
Please leave your comments in English
Posting as Guest
×
Rate this post:
0   Characters
Suggested Locations