Loncat ke daftar isi utama

Bagaimana cara selalu melihat grafik saat menggulir di Excel?

Penulis: Matahari Terakhir Dimodifikasi: 2020-07-22

Jika ada bagan yang dimasukkan ke dalam lembar, saat Anda menggulir lembar ke bawah untuk melihat datanya, bagan tidak dapat dilihat pada saat yang sama seperti gambar di bawah ini yang ditampilkan, yang pasti buruk. Dalam artikel ini, saya memperkenalkan kode VBA untuk menjaga grafik selalu terlihat meskipun menggulir lembar ke bawah atau ke atas.

doc menyimpan grafik dalam tampilan 1
doc panah ke bawah
doc menyimpan grafik dalam tampilan 2

Selalu perhatikan bagan


panah gelembung kanan biru Selalu perhatikan bagan

Untuk mempertahankan grafik dalam tampilan saat menggulir lembar, Anda dapat menerapkan kode VBA di bawah ini untuk menyelesaikannya.

1. Klik kanan pada tab lembar yang Anda inginkan agar grafik tetap terlihat, dan klik Lihat kode membentuk menu konteks. Lihat tangkapan layar:
doc menyimpan grafik dalam tampilan 3

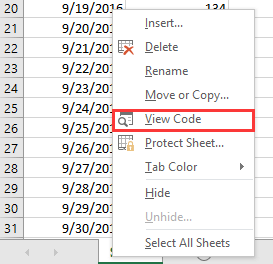
2. Dalam bermunculan Microsoft Visual Basic untuk Aplikasi jendela, tempel kode di bawah ini ke skrip kosong.

VBA: Pertahankan grafik selalu dalam tampilan

Private Sub Worksheet_SelectionChange(ByVal Target As Range)
'UpdatebyExtendoffice20161111
    Dim CPos As Double
    Application.ScreenUpdating = False
    CPos = ActiveWindow.ScrollRow * ActiveCell.RowHeight
    ActiveSheet.ChartObjects("Chart 2").Activate
    ActiveSheet.Shapes("Chart 2").Top = CPos
    ActiveWindow.Visible = False
    Application.ScreenUpdating = True
End Sub

doc menyimpan grafik dalam tampilan 5

3. Simpan dan tutup dialog, lalu grafik akan dipindahkan ke bawah atau ke atas saat Anda mengklik di sel mana pun.
doc menyimpan grafik dalam tampilan 6

Catatan:

(1) Dalam kode VBA, Bagan 2 adalah nama bagan yang ingin Anda perhatikan, Anda dapat mengubahnya sesuai kebutuhan.

(2) VBA ini tidak selalu dapat menampilkan sekelompok grafik.

Alat Produktivitas Kantor Terbaik

馃 Kutools AI Ajudan: Merevolusi analisis data berdasarkan: Eksekusi Cerdas   |  Hasilkan Kode  |  Buat Rumus Khusus  |  Analisis Data dan Hasilkan Grafik  |  Aktifkan Fungsi Kutools...
Fitur Populer: Temukan, Sorot, atau Identifikasi Duplikat   |  Hapus Baris Kosong   |  Gabungkan Kolom atau Sel tanpa Kehilangan Data   |   Putaran tanpa Formula ...
Pencarian Super: VLookup Beberapa Kriteria    VLookup Nilai Berganda  |   VLookup di Beberapa Lembar   |   Pencarian Fuzzy ....
Daftar Drop-down Lanjutan: Buat Daftar Drop Down dengan Cepat   |  Daftar Drop Down yang Bergantung   |  Multi-pilih Drop Down List ....
Manajer Kolom: Tambahkan Jumlah Kolom Tertentu  |  Pindahkan Kolom  |  Alihkan Status Visibilitas Kolom Tersembunyi  |  Bandingkan Rentang & Kolom ...
Fitur Unggulan: Fokus Kisi   |  Tampilan Desain   |   Bar Formula Besar    Manajer Buku Kerja & Lembar   |  Perpustakaan Sumberdaya (Teks otomatis)   |  Pemetik tanggal   |  Gabungkan Lembar Kerja   |  Enkripsi/Dekripsi Sel    Kirim Email berdasarkan Daftar   |  Filter Super   |   Filter Khusus (filter tebal/miring/coret...) ...
15 Perangkat Teratas12 Teks Tools (Tambahkan Teks, Hapus Karakter, ...)   |   50 + Grafik jenis (Gantt Chart, ...)   |   40+ Praktis Rumus (Hitung usia berdasarkan ulang tahun, ...)   |   19 Insersi Tools (Masukkan Kode QR, Sisipkan Gambar dari Jalur, ...)   |   12 Konversi Tools (Angka ke Kata, Konversi Mata Uang, ...)   |   7 Gabungkan & Pisahkan Tools (Lanjutan Gabungkan Baris, Pisahkan Sel, ...)   |   ... dan banyak lagi

Tingkatkan Keterampilan Excel Anda dengan Kutools for Excel, dan Rasakan Efisiensi yang Belum Pernah Ada Sebelumnya. Kutools for Excel Menawarkan Lebih dari 300 Fitur Lanjutan untuk Meningkatkan Produktivitas dan Menghemat Waktu.  Klik Di Sini untuk Mendapatkan Fitur yang Paling Anda Butuhkan...

Deskripsi Produk


Tab Office Membawa antarmuka Tab ke Office, dan Membuat Pekerjaan Anda Jauh Lebih Mudah

  • Aktifkan pengeditan dan pembacaan tab di Word, Excel, PowerPoint, Publisher, Access, Visio, dan Project.
  • Buka dan buat banyak dokumen di tab baru di jendela yang sama, bukan di jendela baru.
  • Meningkatkan produktivitas Anda sebesar 50%, dan mengurangi ratusan klik mouse untuk Anda setiap hari!
Comments (15)
Rated 4.75 out of 5 2 ratings
This comment was minimized by the moderator on the site
A m铆 me pasa que la siguiente vez que abro el archivo, el script ya no funciona. Tengo que copiarlo, borrarlo, cerrar el archivo tras guardarlo, volver a abrir el archivo y volver a pegar el script en VBA. 驴Alguna soluci贸n?
Rated 4.5 out of 5
This comment was minimized by the moderator on the site
Hi, save the workbook as excel macro enable workbook, the vba will be work when open next time.https://cdn.extendoffice.com/images/stories/comments/sun-comment/doc-macro-enable.png
This comment was minimized by the moderator on the site
I encountered a problem with unselecting the cell and needed two charts, So I made some changes and it seems to work now.
To use it put the right Chart Name.
*Note: This one is for two charts


Private Sub worksheet_selectionchange(ByVal target As Range)
Dim chartposition As Double

chartposition = ActiveWindow.ScrollRow * ActiveCell.RowHeight
ActiveSheet.Shapes("Chart 2").Top = chartposition

ActiveSheet.ChartObjects("Chart 3").Top = chartposition + 250

End Sub
This comment was minimized by the moderator on the site
Can any one assist. when i follow theses steps


Private Sub Worksheet_SelectionChange(ByVal Target As Range)
'UpdatebyExtendoffice20161111
Dim CPos As Double
Application.ScreenUpdating = False
CPos = ActiveWindow.ScrollRow * ActiveCell.RowHeight
ActiveSheet.ChartObjects("Chart 2").Activate
ActiveSheet.Shapes("Chart 2").Top = CPos
ActiveWindow.Visible = False
Application.ScreenUpdating = True
End Sub


i get the following err

Run-Time error '-2147024809 (80070057)':
The item with the specified name was not found

when i debug
ActiveSheet.ChartObjects("Chart 2").Activate
This comment was minimized by the moderator on the site
Hi, Christo, you need to change the chart name "Chart 2" to your chart really name in the script. You can click at the chart and see its name in the name box. See screenshot:
https://www.extendoffice.com/images/stories/comments/sun-comment/do_chart_name.png
This comment was minimized by the moderator on the site
yes thanks. after a made the question i realised my chart name was wrong
thanks

ps.
do you perhaps know how i can make the chart kept in view as i scroll without clicking where it must follow
This comment was minimized by the moderator on the site
can I use Kutools to automatically use that VBA for my charts??
This comment was minimized by the moderator on the site
Sorry, Wangnuli, Kutools has not support this so far.
This comment was minimized by the moderator on the site
Hola muchas gracias por el c贸digo, utilizando este c贸digo 驴Hay alguna manera de limitar qu茅 tan alto en la hoja se reubicar谩 el gr谩fico? por ejemplo, no quiero que se coloque encima de la fila 9. Ayuda por favor.
Rated 5 out of 5
This comment was minimized by the moderator on the site
Is there a way to limit how high up on the sheet the chart will relocate to? I don't want it to affix above row 8
This comment was minimized by the moderator on the site
Is there a similar formula that can be built for Google Sheets?
This comment was minimized by the moderator on the site
This macro did exactly what I wanted. However it created another problem that I wondered if you might have a solution to.

While this macro is active I cannot select cells for other purposes such as formatting or merging them. Click and drag, shift nor ctrl work to select a group of cells. I can only select the one cell I clicked on. I frequently want to change formatting (background, fill down a formula, etc.) The only way I have been able to do this is to delete the macro, save, make my formatting changes, paste the macro back in and save.

Is there a simpler way to do this? Perhaps:

1. (preferred) A simple keystroke that would temporarily disable the macro and then re-enable it.

2. Some code added to the macro to allow selection of a group of cells.

Dennis
This comment was minimized by the moderator on the site
This was good but I wish there was a way that it would just move with the scroll wheel, like heading lines. Also if I want to select a cell it takes two clicks. The first click moves the chart but also selects the chart so I have to click again to select the cell.
This comment was minimized by the moderator on the site
I added "activecell.select" on the last line of this code and it fixed the double clicking issue. It will automatically select the last active cell, which will be the one you clicked on to move the chart. Hope this helps.
This comment was minimized by the moderator on the site
THIS IS WHAT I NEEDED! GOLDEN!
There are no comments posted here yet
Please leave your comments in English
Posting as Guest
Rate this post:
0   Characters
Suggested Locations