Loncat ke daftar isi utama

Bagaimana cara mengekstrak data dari bagan atau grafik di Excel?

doc-ekstrak-bagan-data-1
Di Excel, kami biasanya menggunakan grafik untuk menampilkan data dan tren agar lebih jelas dilihat, tetapi terkadang, mungkin grafik tersebut adalah salinan dan Anda belum memiliki data asli dari grafik seperti gambar di bawah ini. Dalam kasus ini, Anda mungkin ingin mengekstrak data dari bagan ini. Sekarang tutorial ini berbicara tentang penggalian data dari bagan atau grafik.
Ekstrak data dari grafik dengan VBA

panah gelembung kanan biru Ekstrak data dari grafik dengan VBA

1. Anda perlu membuat lembar kerja baru dan menamainya sebagai Data Bagan. Lihat tangkapan layar:

doc-ekstrak-bagan-data-5

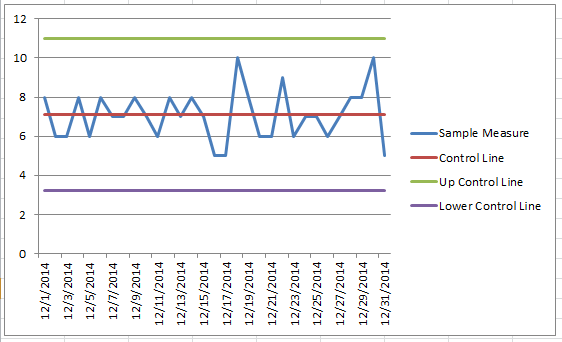
2. Kemudian pilih grafik yang datanya ingin Anda ekstrak dan tekan Alt + F11 kunci secara bersamaan, dan a Microsoft Visual Basic untuk Aplikasi jendela muncul.

3. klik Menyisipkan > Modul, lalu tempel kode VBA di bawah ini ke popping Modul jendela.

VBA: Ekstrak data dari grafik.

Sub GetChartValues()
    'Updateby20220510
    Dim xNum As Integer
    Dim xSeries As Object
    On Error Resume Next
    xCount = 2
    xNum = UBound(Application.ActiveChart.SeriesCollection(1).Values)
    Application.Worksheets("ChartData").Cells(1, 1) = "X Values"
    With Application.Worksheets("ChartData")
        .Range(.Cells(2, 1), _
        .Cells(xNum + 1, 1)) = _
        Application.Transpose(ActiveChart.SeriesCollection(1).XValues)
    End With
    For Each xSeries In Application.ActiveChart.SeriesCollection
        Application.Worksheets("ChartData").Cells(1, xCount) = xSeries.Name
        With Application.Worksheets("ChartData")
            .Range(.Cells(2, xCount), _
            .Cells(xNum + 1, xCount)) = _
            Application.WorksheetFunction.Transpose(xSeries.Values)
        End With
        xCount = xCount + 1
    Next
End Sub

4. Lalu klik Run tombol untuk menjalankan VBA. Lihat tangkapan layar:

doc-ekstrak-bagan-data-2

Kemudian Anda dapat melihat data diekstrak ke Data Bagan lembar.
doc-ekstrak-bagan-data-3

olymp trade indonesiaTip:

1. Anda dapat memformat sel sesuai kebutuhan.

doc-ekstrak-bagan-data-4

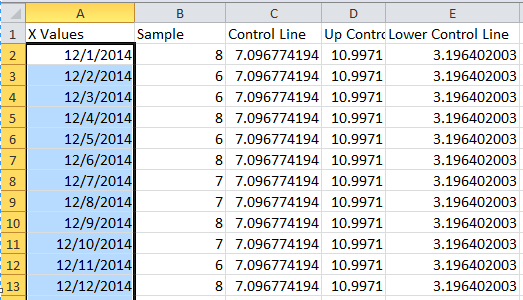
2. Data dari bagan yang dipilih diekstraksi ke sel pertama dari lembar ChartData secara default.


olymp trade indonesiaTip: Jika Anda biasanya menggunakan bagan kompleks di Excel, yang akan merepotkan saat Anda membuatnya tepat waktu, di sini dengan Teks otomatis alat dari Kutools untuk Excel, Anda hanya perlu membuat bagan pertama kali, lalu menambahkan bagan di panel AutoText, lalu Anda dapat menggunakannya kembali di mana saja kapan saja, yang perlu Anda lakukan hanyalah mengubah referensi agar sesuai dengan kebutuhan Anda yang sebenarnya.  Klik untuk unduh gratis sekarang.
doc format bersyarat grafik batang bertumpuk 12

Alat Produktivitas Kantor Terbaik

🤖 Kutools AI Ajudan: Merevolusi analisis data berdasarkan: Eksekusi Cerdas   |  Hasilkan Kode  |  Buat Rumus Khusus  |  Analisis Data dan Hasilkan Grafik  |  Aktifkan Fungsi Kutools...
Fitur Populer: Temukan, Sorot, atau Identifikasi Duplikat   |  Hapus Baris Kosong   |  Gabungkan Kolom atau Sel tanpa Kehilangan Data   |   Putaran tanpa Formula ...
Pencarian Super: VLookup Beberapa Kriteria    VLookup Nilai Berganda  |   VLookup di Beberapa Lembar   |   Pencarian Fuzzy ....
Daftar Drop-down Lanjutan: Buat Daftar Drop Down dengan Cepat   |  Daftar Drop Down yang Bergantung   |  Multi-pilih Drop Down List ....
Manajer Kolom: Tambahkan Jumlah Kolom Tertentu  |  Pindahkan Kolom  |  Alihkan Status Visibilitas Kolom Tersembunyi  |  Bandingkan Rentang & Kolom ...
Fitur Unggulan: Fokus Kisi   |  Tampilan Desain   |   Bar Formula Besar    Manajer Buku Kerja & Lembar   |  Perpustakaan Sumberdaya (Teks otomatis)   |  Pemetik tanggal   |  Gabungkan Lembar Kerja   |  Enkripsi/Dekripsi Sel    Kirim Email berdasarkan Daftar   |  Filter Super   |   Filter Khusus (filter tebal/miring/coret...) ...
15 Perangkat Teratas12 Teks Tools (Tambahkan Teks, Hapus Karakter, ...)   |   50 + Grafik jenis (Gantt Chart, ...)   |   40+ Praktis Rumus (Hitung usia berdasarkan ulang tahun, ...)   |   19 Insersi Tools (Masukkan Kode QR, Sisipkan Gambar dari Jalur, ...)   |   12 Konversi Tools (Angka ke Kata, Konversi Mata Uang, ...)   |   7 Gabungkan & Pisahkan Tools (Lanjutan Gabungkan Baris, Pisahkan Sel, ...)   |   ... dan banyak lagi

Tingkatkan Keterampilan Excel Anda dengan Kutools for Excel, dan Rasakan Efisiensi yang Belum Pernah Ada Sebelumnya. Kutools for Excel Menawarkan Lebih dari 300 Fitur Lanjutan untuk Meningkatkan Produktivitas dan Menghemat Waktu.  Klik Di Sini untuk Mendapatkan Fitur yang Paling Anda Butuhkan...

Deskripsi Produk


Tab Office Membawa antarmuka Tab ke Office, dan Membuat Pekerjaan Anda Jauh Lebih Mudah

  • Aktifkan pengeditan dan pembacaan tab di Word, Excel, PowerPoint, Publisher, Access, Visio, dan Project.
  • Buka dan buat banyak dokumen di tab baru di jendela yang sama, bukan di jendela baru.
  • Meningkatkan produktivitas Anda sebesar 50%, dan mengurangi ratusan klik mouse untuk Anda setiap hari!
Comments (18)
No ratings yet. Be the first to rate!
This comment was minimized by the moderator on the site
Amazing...
This comment was minimized by the moderator on the site
Very helpful! Thanks a lot!
This comment was minimized by the moderator on the site
giving error and tell to set block variables and object variables
This comment was minimized by the moderator on the site
Hi, I have updated the VBA, you can try it again.
This comment was minimized by the moderator on the site
i tried above & it says "Compile error: Method or Data Member not found"
This comment was minimized by the moderator on the site
mong mọi người giúp đỡ làm cách nào để lấy số liệu từ biểu đồ này với ạ!
This comment was minimized by the moderator on the site
i m getting below error while running that command.
this error comes in that command which starts from xnum = UBound(......) etc

Run-Time error '91'
object variable or with block variable not set
This comment was minimized by the moderator on the site
Hi, tarshul, you need to create a new worksheet named ChartData before you running the code, the data will be place in the new worksheet ChartData.
This comment was minimized by the moderator on the site
Hi sunny,
I already create new worksheet as u told but still getting same error.
This comment was minimized by the moderator on the site
This doesn't appear to work for a scatter plot as it only extracts one set of "x" data. How can I amend it to extract all "x" data sets?
This comment was minimized by the moderator on the site
Sorry I did not found the solution about that.
This comment was minimized by the moderator on the site
i've tried with a scatter plot graph as well, but only get one line of valor.


i need so much to find a way to extract data from scatterplot graphs.
This comment was minimized by the moderator on the site
I failed to get the prices of a fund chart on my mac excel 2011 . Run time error '91' object variable or block variable not set . Don't know how to debug . Appreciate any help .
This comment was minimized by the moderator on the site
Very useful and perfect
This comment was minimized by the moderator on the site
gives me values that i created chart with not all the values in range
This comment was minimized by the moderator on the site
Amazing command, thanks a lot! I used it with a pivot chart and it works!
There are no comments posted here yet
Load More
Please leave your comments in English
Posting as Guest
×
Rate this post:
0   Characters
Suggested Locations