Loncat ke daftar isi utama

Bagaimana cara membalikkan urutan sumbu di Excel?

Penulis: Matahari Terakhir Dimodifikasi: 2022-10-08

Terkadang, Anda mungkin perlu membalik urutan sumbu dalam grafik. Misalnya, dalam diagram batang, dibandingkan dengan data, urutan sumbu dibalik secara default, dalam hal ini, Anda mungkin ingin membalik urutan sumbu untuk memenuhi urutan data seperti yang ditunjukkan di bawah ini. Sekarang tutorial ini akan memberi tahu Anda cara membalik urutan sumbu dengan cepat di Excel.

doc-reverse-axis-1 doc panah kanan doc-reverse-axis-1

Urutan sumbu terbalik dalam bagan


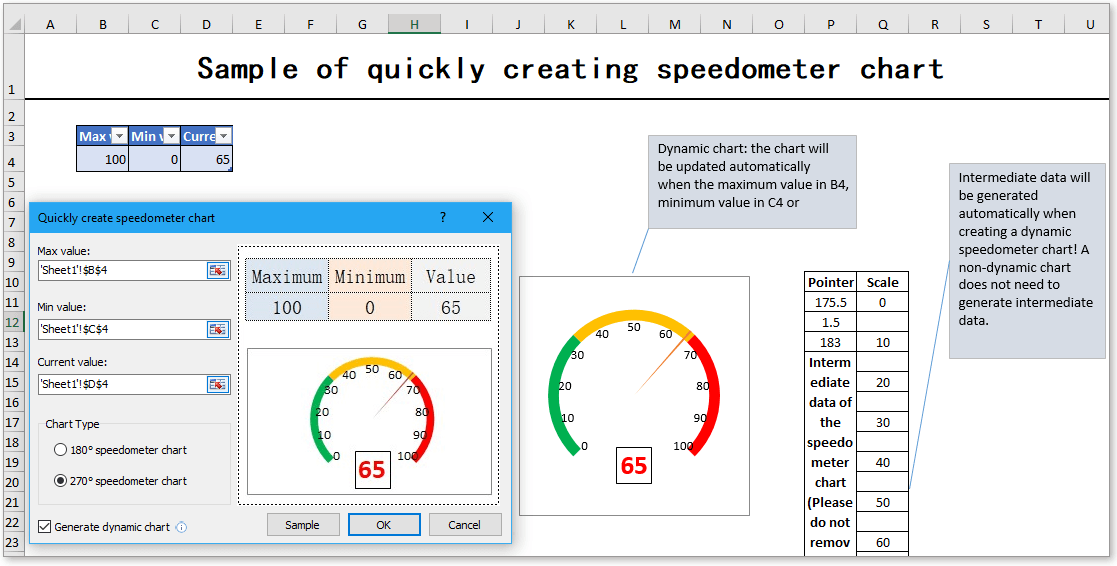
Buat diagram speedometer dengan dua langkah!

Terkadang, Anda mungkin ingin menggunakan diagram speedometer untuk menampilkan pricessing suatu proyek, tetapi di Excel, untuk membuat diagram speedometer membutuhkan banyak langkah yang rumit dan membuang-buang waktu. Di sini Bagan speedometer alat di Kutools for Excel dapat membantu Anda membuat grafik speedometer standar dengan dua langkah sederhana. Unduh alat ini dengan uji coba gratis 30 hari sekarang.
grafik speedometer doc

panah gelembung kanan biru Urutan sumbu terbalik dalam bagan

Ada opsi dalam dialog Format Axis untuk membalik urutan sumbu.

1. Klik kanan sumbu y yang ingin Anda balikkan, lalu pilih Format sumbus dari menu konteks. Lihat tangkapan layar:

doc-reverse-axis-1

2. Kemudian di panel Format Axis yang muncul, di bawah tab Opsi Sumbu, centang Kategori dalam opsi urutan terbalik, lalu centang Pada opsi kategori maksimum.

doc-reverse-axis-1

olymp trade indonesiaTip: Pada diagram batang, pesan sumbu x dengan klik kanan sumbu x dan pilih Format Sumbu dari menu konteks, lalu periksa Nilai dalam urutan terbalik.

Sekarang sumbu Y telah dibalik

doc-reverse-axis-1

Alat Produktivitas Kantor Terbaik

🤖 Kutools AI Ajudan: Merevolusi analisis data berdasarkan: Eksekusi Cerdas   |  Hasilkan Kode  |  Buat Rumus Khusus  |  Analisis Data dan Hasilkan Grafik  |  Aktifkan Fungsi Kutools...
Fitur Populer: Temukan, Sorot, atau Identifikasi Duplikat   |  Hapus Baris Kosong   |  Gabungkan Kolom atau Sel tanpa Kehilangan Data   |   Putaran tanpa Formula ...
Pencarian Super: VLookup Beberapa Kriteria    VLookup Nilai Berganda  |   VLookup di Beberapa Lembar   |   Pencarian Fuzzy ....
Daftar Drop-down Lanjutan: Buat Daftar Drop Down dengan Cepat   |  Daftar Drop Down yang Bergantung   |  Multi-pilih Drop Down List ....
Manajer Kolom: Tambahkan Jumlah Kolom Tertentu  |  Pindahkan Kolom  |  Alihkan Status Visibilitas Kolom Tersembunyi  |  Bandingkan Rentang & Kolom ...
Fitur Unggulan: Fokus Kisi   |  Tampilan Desain   |   Bar Formula Besar    Manajer Buku Kerja & Lembar   |  Perpustakaan Sumberdaya (Teks otomatis)   |  Pemetik tanggal   |  Gabungkan Lembar Kerja   |  Enkripsi/Dekripsi Sel    Kirim Email berdasarkan Daftar   |  Filter Super   |   Filter Khusus (filter tebal/miring/coret...) ...
15 Perangkat Teratas12 Teks Tools (Tambahkan Teks, Hapus Karakter, ...)   |   50 + Grafik jenis (Gantt Chart, ...)   |   40+ Praktis Rumus (Hitung usia berdasarkan ulang tahun, ...)   |   19 Insersi Tools (Masukkan Kode QR, Sisipkan Gambar dari Jalur, ...)   |   12 Konversi Tools (Angka ke Kata, Konversi Mata Uang, ...)   |   7 Gabungkan & Pisahkan Tools (Lanjutan Gabungkan Baris, Pisahkan Sel, ...)   |   ... dan banyak lagi

Tingkatkan Keterampilan Excel Anda dengan Kutools for Excel, dan Rasakan Efisiensi yang Belum Pernah Ada Sebelumnya. Kutools for Excel Menawarkan Lebih dari 300 Fitur Lanjutan untuk Meningkatkan Produktivitas dan Menghemat Waktu.  Klik Di Sini untuk Mendapatkan Fitur yang Paling Anda Butuhkan...

Deskripsi Produk


Tab Office Membawa antarmuka Tab ke Office, dan Membuat Pekerjaan Anda Jauh Lebih Mudah

  • Aktifkan pengeditan dan pembacaan tab di Word, Excel, PowerPoint, Publisher, Access, Visio, dan Project.
  • Buka dan buat banyak dokumen di tab baru di jendela yang sama, bukan di jendela baru.
  • Meningkatkan produktivitas Anda sebesar 50%, dan mengurangi ratusan klik mouse untuk Anda setiap hari!
Comments (11)
No ratings yet. Be the first to rate!
This comment was minimized by the moderator on the site
Merci beaucoup pour ces explications détaillées et efficaces!!!
This comment was minimized by the moderator on the site
Obrigado amigo!
This comment was minimized by the moderator on the site
When you reverse the order of the y axis, how do you keep the x axis labels at the bottom of the chart? And, why do they move to the top of the chart?
This comment was minimized by the moderator on the site
worksss !!
This comment was minimized by the moderator on the site
Click "categories in reverse order" to fix the order problem, then click "value (Y) axis crosses at maximum category" to put the axis at the bottom. These two together will make horizontal bar charts work the way any normal human would want... :-)
This comment was minimized by the moderator on the site
5 years on and this comment by Sandy still helped me.

Literally made a disposable account just to say thank you.

Micro$**t - fix your charts. Totally unexpected and utterly useless chart behaviour. Why would I EVER want the entire x-axis to shift based on what I want the y-axis to look like?????
This comment was minimized by the moderator on the site
Thank you so much
This comment was minimized by the moderator on the site
You're the best, thanks!
This comment was minimized by the moderator on the site
Double Thanks Sandy.


Why on Earth am I formatting the Horizontal Axis in the Vertical Axis Format Properties Microsoft?!?!?!?! I NEVER would have figured this out without Sandy.
This comment was minimized by the moderator on the site
Thanks Sandy
This comment was minimized by the moderator on the site
This is good; however, I still need the x-axis lables to remain at the bottom fo the chart. When you reverse the order, they move to the top. Who would want the axis labels at the top of the chart????
There are no comments posted here yet
Please leave your comments in English
Posting as Guest
×
Rate this post:
0   Characters
Suggested Locations